
|
http://formontana.net/home.html Here’s a demonstration that serves as an effective introduction to my explanation of the El Nino phenomenon. I use this the day after my students have done the ocean currents lab (click here to see it). Materials 2 liters of very cold water (icewater without the ice) clear plastic box (like the one shown in the photo below) 50-75 ml of hot water (very hot tapwater should work) red food coloring spoon Procedures 1. Position the clear box so that it is about eye-level for the students. 2. Pour 2 liters of very cold water into the box, and let it become calm. 3. Mix 5-10 drops of red food coloring into a beaker containing 50-75 ml of very hot tapwater. 4. Using a spoon to “cushion” the fall, gently pour the hot water onto the surface of the cold water. 5. Have the students observe, noting that (because of a difference in density) the hot water “floats” on the colder water as shown below. This photo shows what will happen during the demo. Ask your students why such a layer would develop in the ocean. (ANSWER: The sun heats the surface waters, especially near the equator.) Tell them that the box represents only the top 1000 meters of the equatorial region of the Pacific, but that it is not the normal situation. (NOTE: I used a little too much red water.) 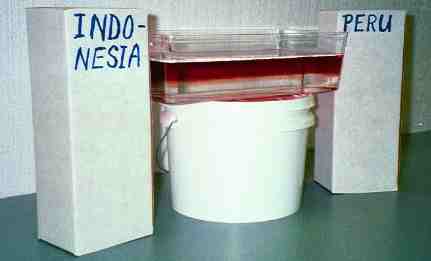 Below: Normally, the trade winds push this warm layer away from Peru, “piling it up” near Indonesia, and causing an upwelling of cold water off the coast of Peru as shown below. To show the normal situation in the equatorial Pacific, sketch this diagram on the board. 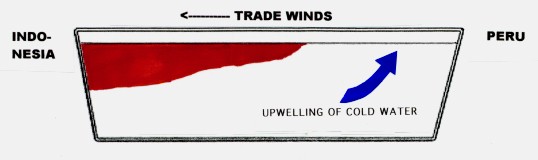 This upwelling brings nutrients to the surface where they combine with sunshine to cause an abundance of plankton (fish food). The diagram shows a normal year similar to the January '97 image shown in these images from the El Nino Theme Page. During an El Nino event, the trade winds falter, or even reverse, allowing the warm water to flow back, or be pushed back toward Peru as shown in the November '97 and March "98 images. A sketch just the opposite of the above diagram would represent an extreme El Nino. . . The area of warm water would be on the Peru side of the ocean. One Connection to Weather Where the surface waters are warm, there will be more vapor in the air, causing more clouds and more rain in that region. During a normal year, this will be near Indonesia. During the recent El Nino, Indonesia experienced drought, whereas South America had tremendous rains. This is just one of many ways that an El Nino can alter our planet’s normal weather. |
 |
Back to RODNEYS HOMEPAGE for Earth Science Teachers |